SaaS retention metrics can pull you in every direction. Every day on X, I see a new post telling SaaS teams they need to start tracking yet another absurd metric.
I want you to ignore most of it. Founders come to us having tracked their numbers diligently for months, sometimes years, and they're still not quite sure why their retention story doesn't feel like it's improving.
I think most of this comes down to the fact that they’re measuring the wrong stuff.
The tidbits of information they get probably obscure more than they reveal.
If you really had access to great data on churn, how many users could you save from cancelling?
It’s a whole lot more than you think!
I’m going to walk you through the misleading SaaS retention metrics and suggest a data source most teams already have that could make all of this considerably clearer for you.
Why So Many Teams Are Measuring Retention Wrong
I’ve seen way too many teams just defaulting to whatever’s easiest to set up.
We have a ridiculous obsession with churn rate and logo retention.
There… I said it!
I don’t think those two metrics are particularly useful.
Yes, I obviously want you to track them, but they’re not exactly telling you much.
Churn rate gets calculated because it's familiar and logo retention is only really tracked because it's simple.
There’s this tendency to build an entire retention narrative around those two numbers and I don’t feel like that’s in any way useful.
Actually, let me rephrase that…
I don’t feel that way… I know it to be true.
I’ve seen loads of teams set up retention metrics early and never question whether those formulas still make sense as they start to grow.
So they end up tracking useless numbers that they can’t do anything with.
Some SaaS Retention Metrics Will Mislead You…
Let me start here, because these are the ones I see causing the most damage…
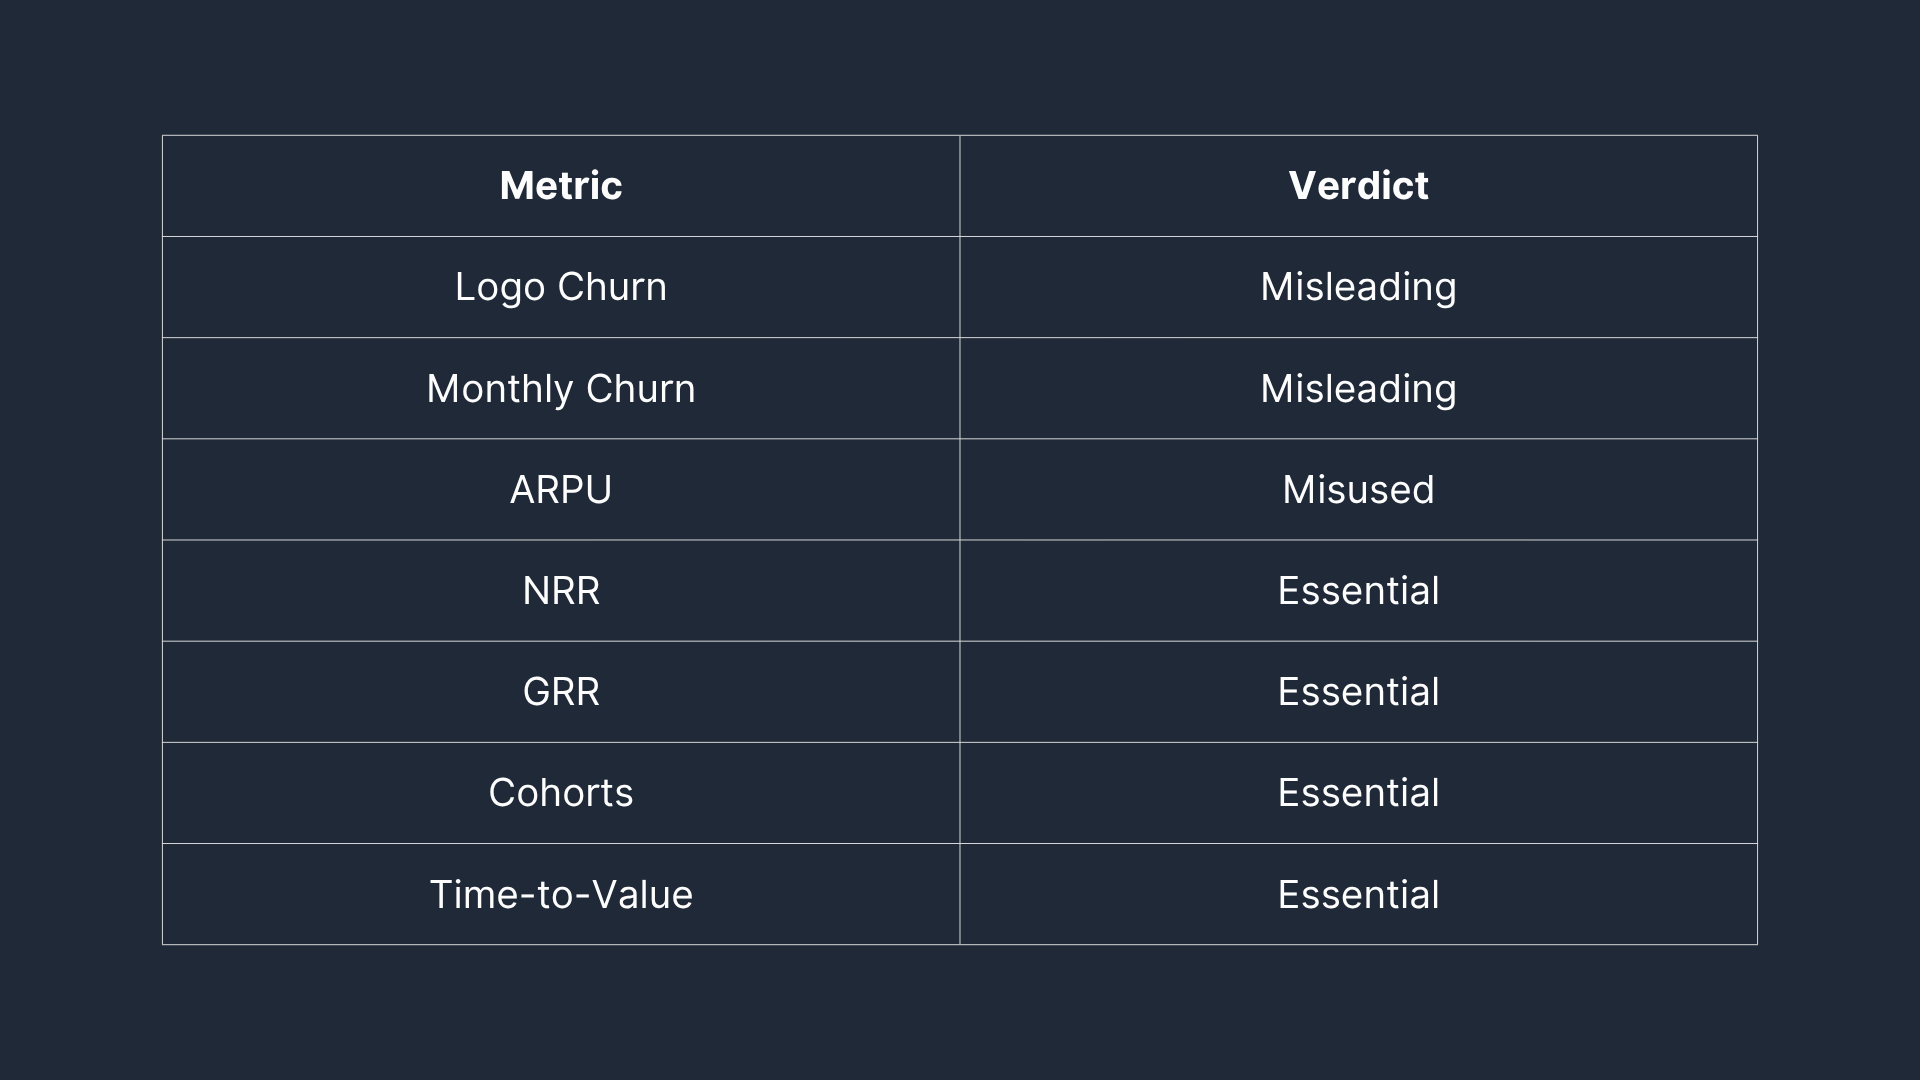
Logo Churn Rate
Logo churn rate is the first one worth questioning.
Counting the number of customers who leave as a percentage of total customers sounds reasonable until you realize it treats a $50 per month cancellation the same as a $5,000 per month cancellation.
If you're losing small accounts and retaining large ones, logo churn will make things look worse than they are. If the reverse is true, it'll make things look way better than they are.
I want to make it clear that neither version is telling you what you need to know.
Monthly Churn Rate
Monthly churn rate has a similar problem. It's easy to calculate and easy to report, but it doesn’t…
- Account for expansion revenue.
- Distinguish between voluntary and involuntary churn.
- Tell you which customer segments are healthy.
If I’m honest with you, teams most attached to this metric usually haven’t made a hard retention decision based on it.
Average Revenue Per User
Average revenue per user, or ARPU, also gets misused as a proxy for retention health. It's not a retention metric, but everyone seems to treat it like one.
Watching ARPU climb while net revenue retention deteriorates is a super uncomfortable thing to try and explain to a board.
Here Are The SaaS Retention Metrics I Want You To Start Ranking
Net Revenue Retention
Net revenue retention is the number I'd start with if I were building a retention dashboard from scratch.
I like this metric because it captures what happens to revenue from your existing customer base over time, including expansion, contraction, and churn, all in a single figure.
A number above 100% tells you your existing customers are growing with you even before you add a single new one. As far as I’m concerned, that's the story worth telling.
Gross Revenue Retention
Gross revenue retention sits alongside it as an essential companion. Where NRR includes expansion and can therefore mask underlying churn, GRR strips that out and shows you the floor.
If your GRR is low, expansion revenue is papering over a retention problem that will eventually catch up with you. Tracking both together gives you a much more complete picture than either does on its own.
Cohort Retention Analysis
Cohort retention analysis is the third formula I’d recommend building into your process.
Yes, I know it takes a bit more effort to set up.
You need to see how customer groups behave over time and segment them by things like…
- Acquisition channel
- Subscription plan type
- Onboarding experience
You’ll then start to pick up some patterns that you’re just not going to find with aggregate metrics.
I’m talking about realizing that what looks like a company-wide retention problem is really concentrated in one specific cohort.
Time-to-Value
Time-to-value is worth tracking alongside these, particularly if you're seeing early churn concentrated in the first 30 to 60 days.
How quickly a customer reaches their first meaningful outcome in your product is one of the strongest leading indicators of whether they'll still be there at month six.
SaaS Teams Don’t Even Realize That They’re Sitting On A Goldmine
We’re forgetting something…
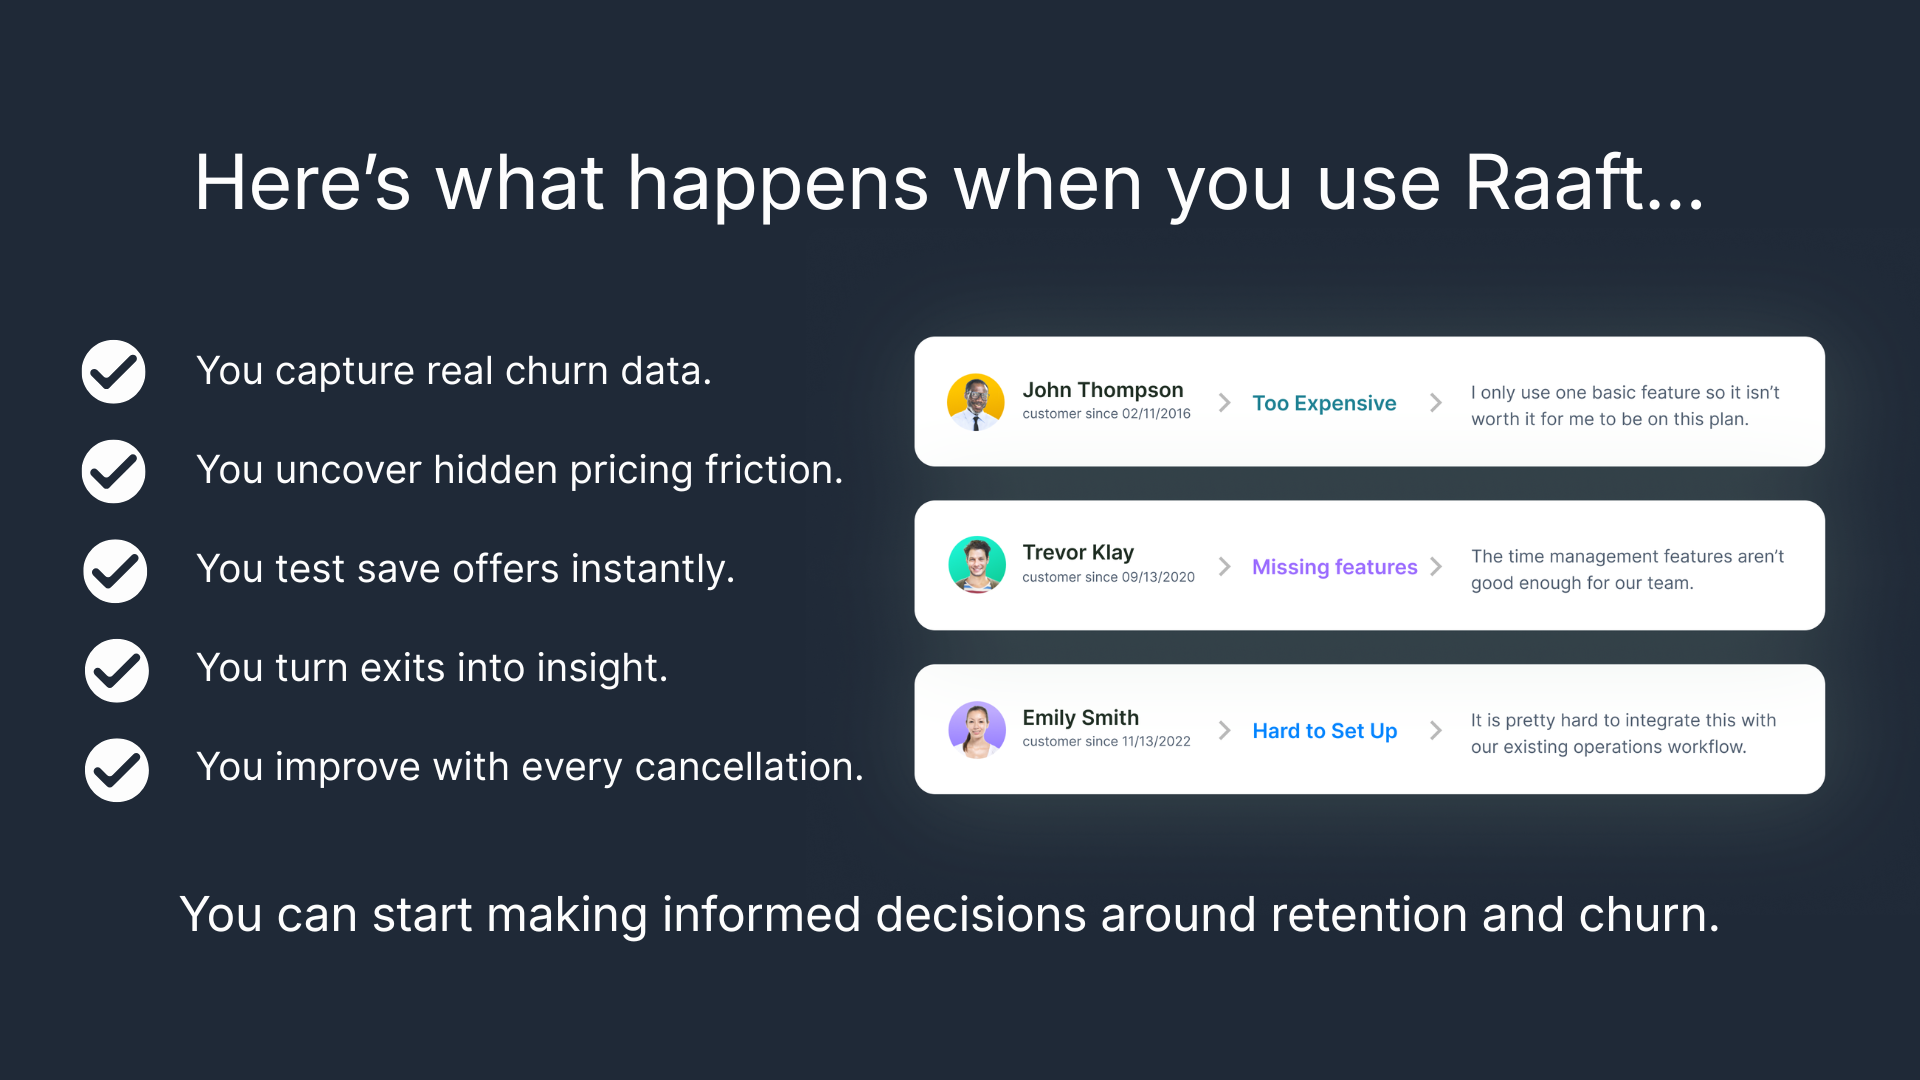
The most useful retention data you have is sitting in your cancellation flow, or more accurately, in the structured feedback that a good cancellation flow captures on the way out.
SaaS retention metrics can tell you that churn went up in a given month.
What they can't tell you, on their own, is whether that churn happened because of pricing friction, a missing feature, a competitor, or something in your onboarding that never got fixed.
Much easier to make decisions on retention when you have all of the facts!
When I speak with founders about this, the ones who have structured cancellation flows in place are always working with a richer picture than those who don't.
This brings me to Raaft...
It’s a free platform for creating and integrating cancellation flows.
When a customer moves to cancel, Raaft captures their reason in a structured way, presents a targeted offer based on their plan and situation, and feeds that data directly back into the decisions you're already trying to make with your SaaS retention metrics.
It takes about 30 minutes to set up, there's no development work required, and you can get started for free.
By the time you've got your NRR and GRR dashboards humming, having Raaft running alongside them means you'll finally understand the story behind the numbers.

Offboarding Cheatsheet
This framework + video tutorial will help you design a better cancellation process.
Some of our featured articles


Miguel Marques

Miguel Marques

Miguel Marques
Customer Success insights in your inbox
Helping Founders and Customer Success Managers handle customer retention effectively.
We will only ever send you relevant content. Unsubscribe anytime.